About Tech
- output.js is mostly for making cards, call functions that get data needed
- chart.js makes the graphs, calls the search function to get the data
- app.js is where the program is run and controlled from
- search.js is where the stock market api is called and json is returned
- index.html is what is used to run the page
Run Bot Locally
- You will first need accounts with the following services (all of the following services provide a free tier and/or student trials)
- IBM Cloud (IBM Watson)
- IEX Cloud (Stock Market Api Data)
- Cloudinary (image hosting)
- Plotly (chart maker)
- AlphaVantage (S&P, NASDAQ, DJI data)
- Gather Api credentials and plug them into the .env_unfilled file
- Note that for IBM Cloud you have to first make an Watson Assistant Service, and use the Api Keys for that
- Note that not all the .env fields need to be filled to run locally
- Note change the
.env_unfilled filenameto.env
- Run the "index.html" file. You can do this by simply opening the html file up in a web browser such as Chrome, Internet Explorer, etc. *Note that appid and password don't need to be set in the .env and emulator for local deployments
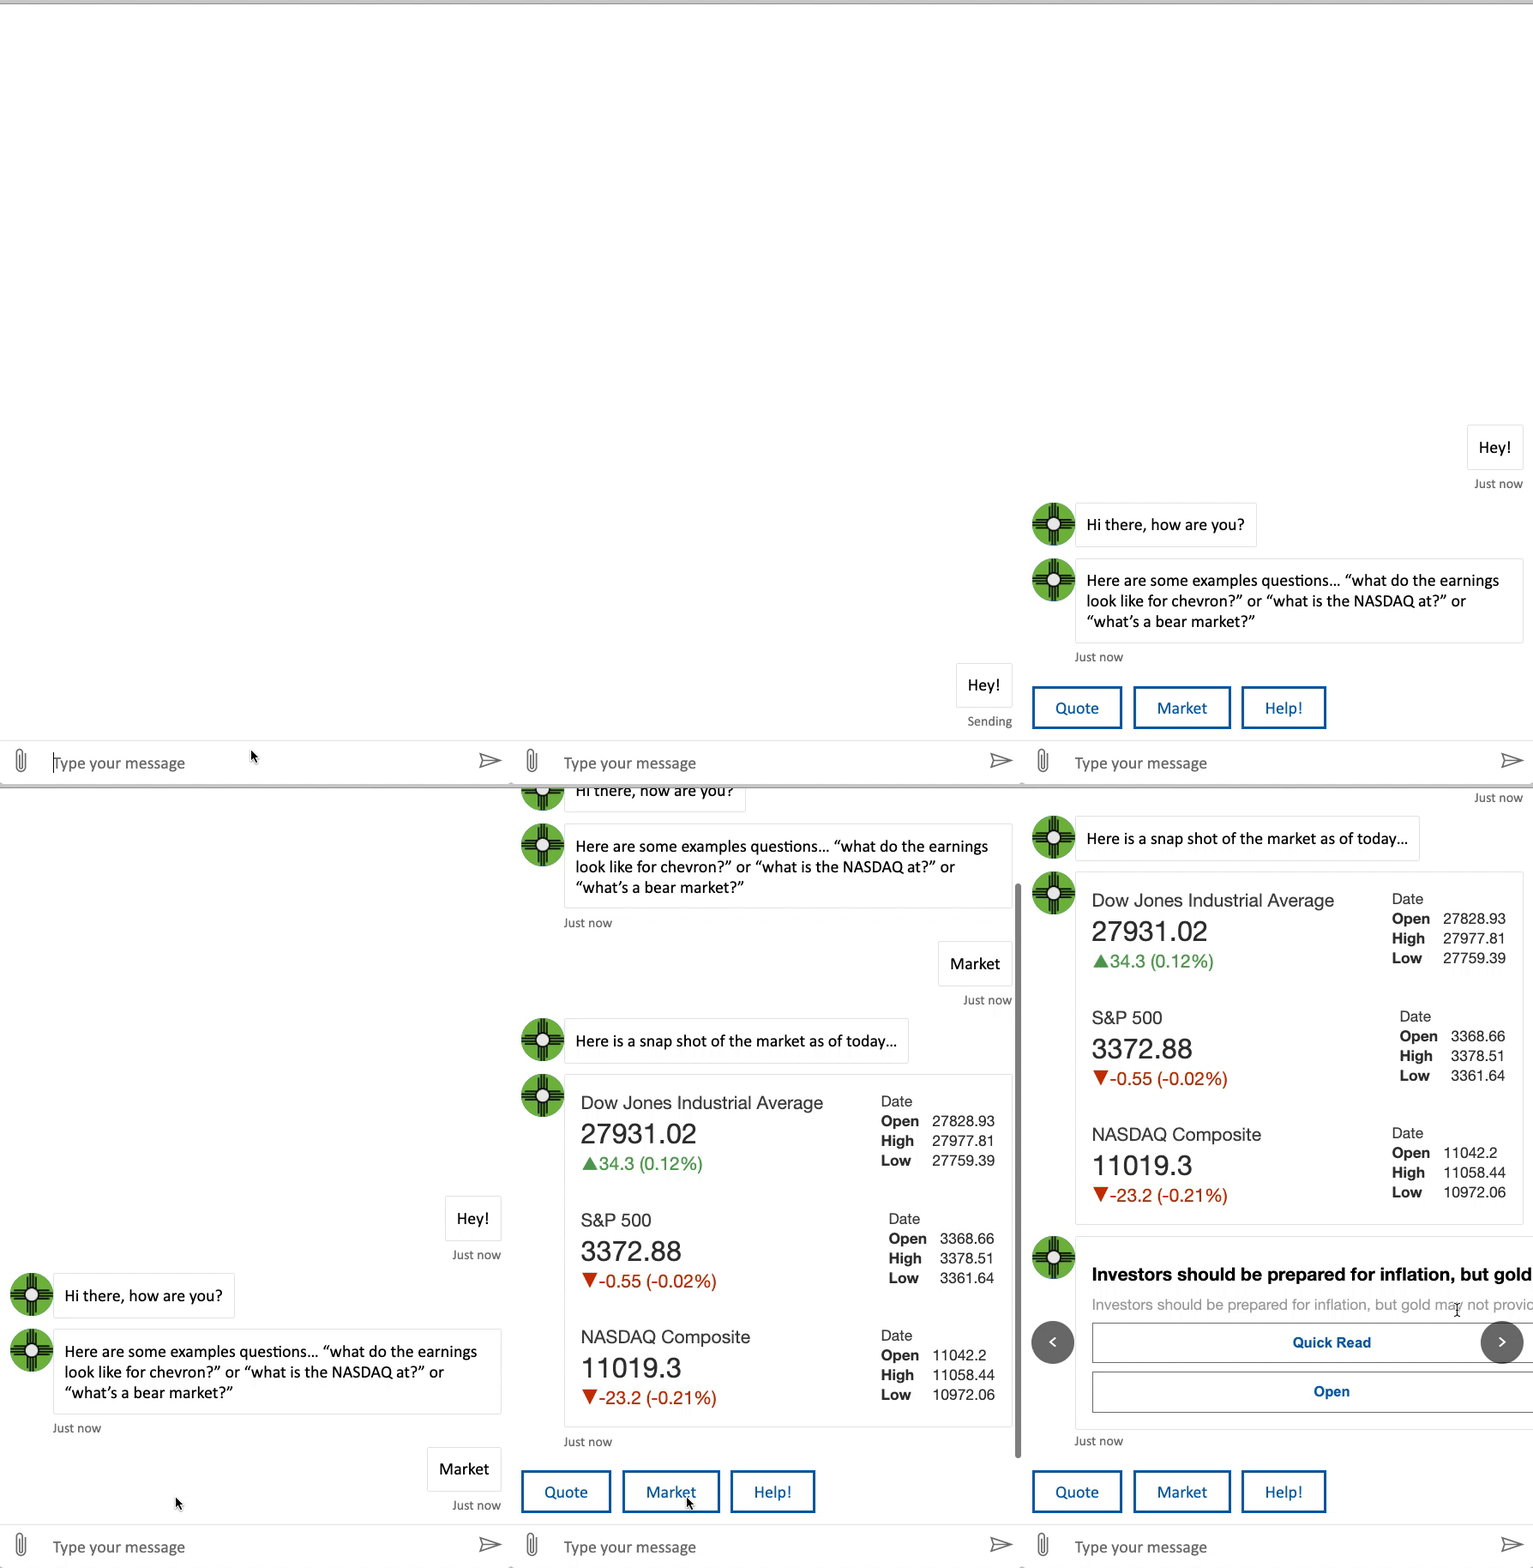
- Say 'Hello' and everything should be setup and working locally
